For visual appearance/turf quality the values ranged from 5.5-8.6 (minimally acceptable equals 6.0) and varied by date and product applied.
For mean quality the values ranged from 5.9 to 7.5 with all treatments being superior to the non-treated control (5.9).
The greening/growth response following the first application (18 Aug.) was not very dramatic, likely due to prolonged warmth, dry conditions and possibly some late-summer turf stress but some treatment separation became evident on 19 September.
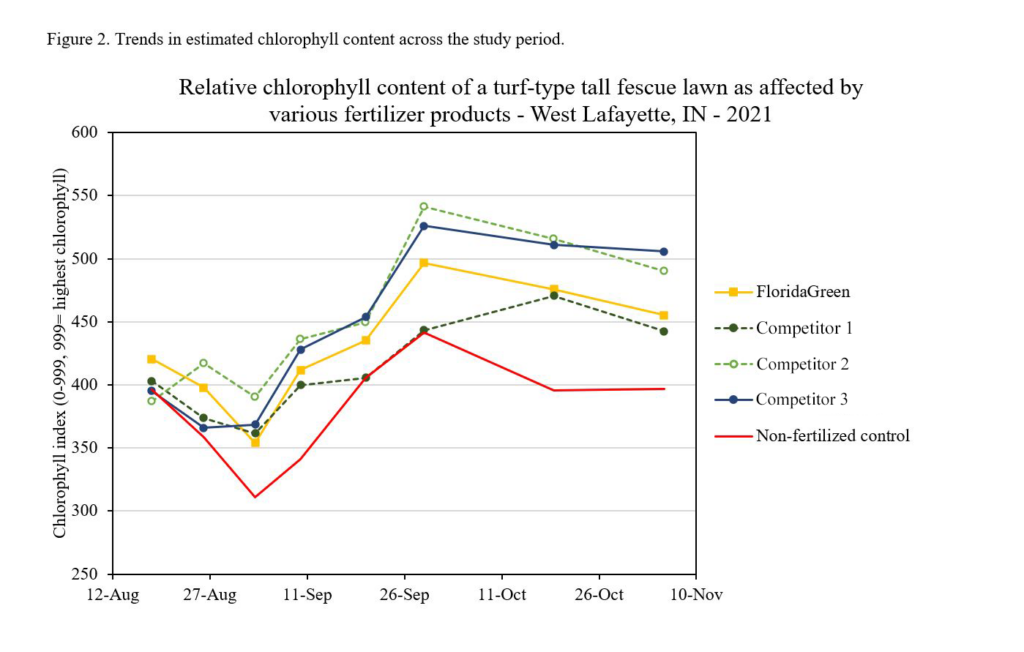
Relative Chlorophyll Content
For relative chlorophyll content, values ranged between 311-541, varying with fertilizer treatment and measurement date.
Increased relative chlorophyll content was observed with all fertilizer treatments compared to the non-fertilized control.
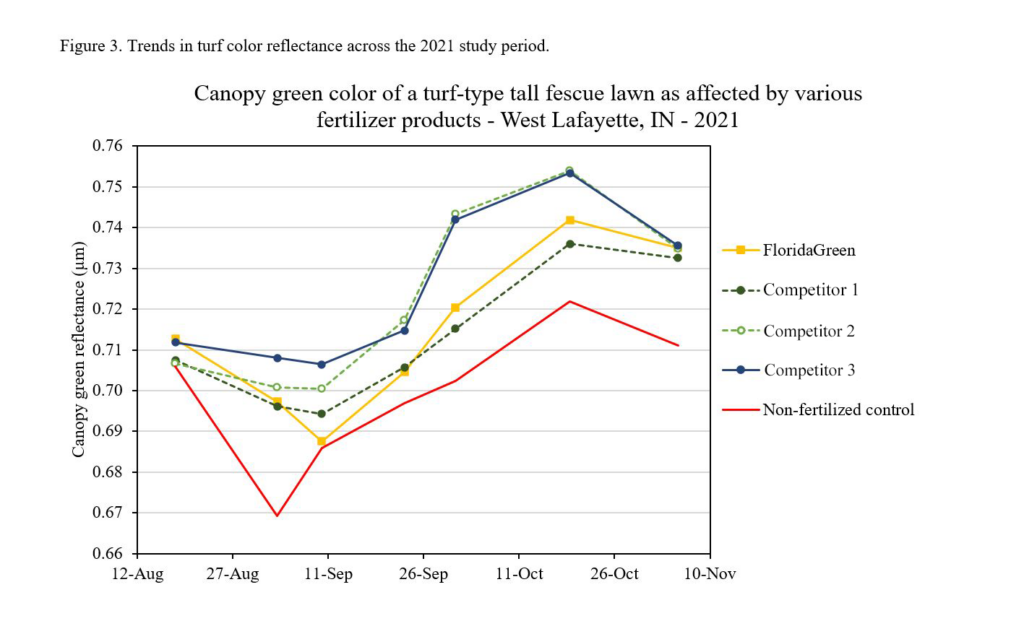
Turf Color
For turf color, values ranged from 0.669-0.759. with all treatments being superior to the non-treated control.
On 1 October and 19 October, increased color was observed for FloridaGreen and competitors.
Summary of Results Summer 2021
Visual Quality
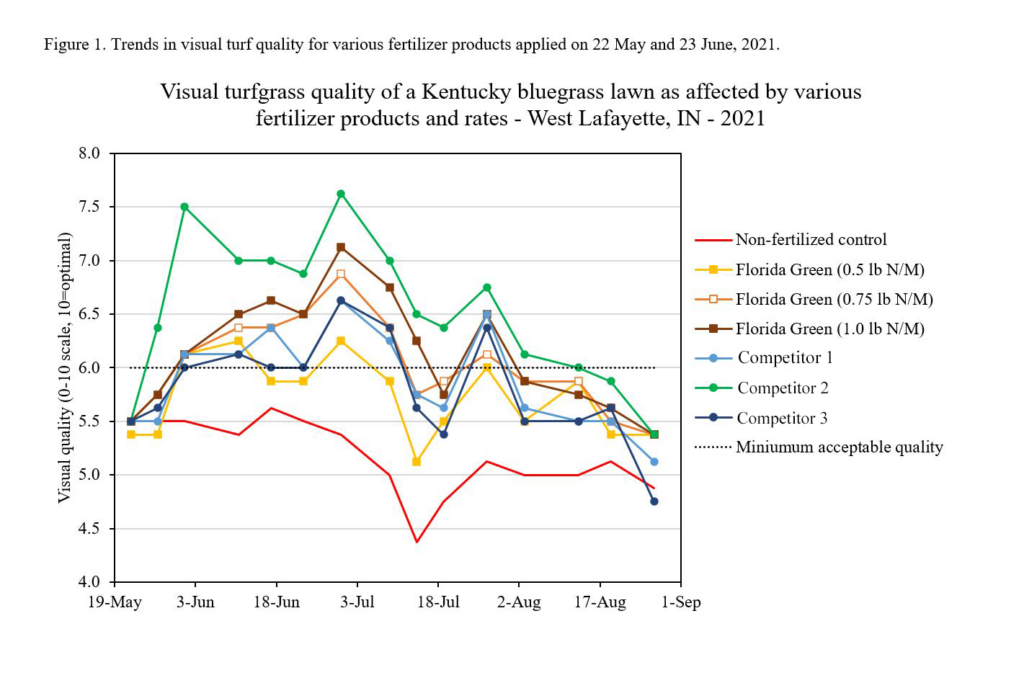
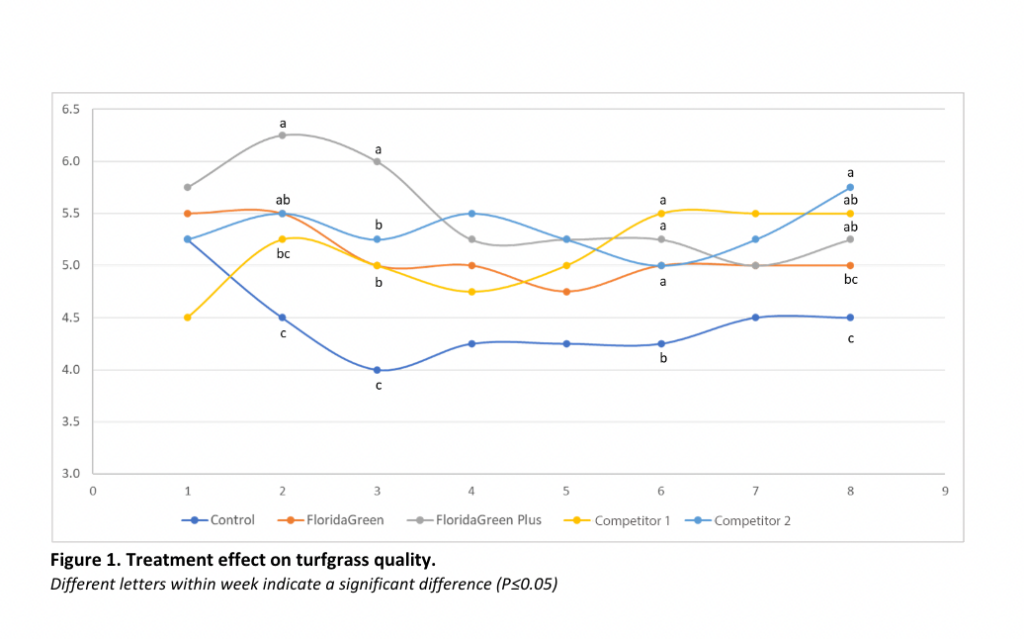
For visual appearance/turf quality the values ranged from 4.4-7.6 (minimally acceptable equals 6.0) and varied by date fertilizer product application rate.
For mean quality the values ranged from 5.2 to 6.5 with all treatments being superior to the non-treated control (5.2).
Increased turf quality values were observed with a synthetic competitor and the biosolid fertilizers for FloridaGreen applied at 0.75lb N/M and 1.0lb N/M compared to FloridaGreen applied at 0.5lb N/M.
The longevity of the greening responses of these fertilizers was about 5-7 weeks. For example the greening response relative to the non-fertilized control from the 24 June application lasted until about 3 August.
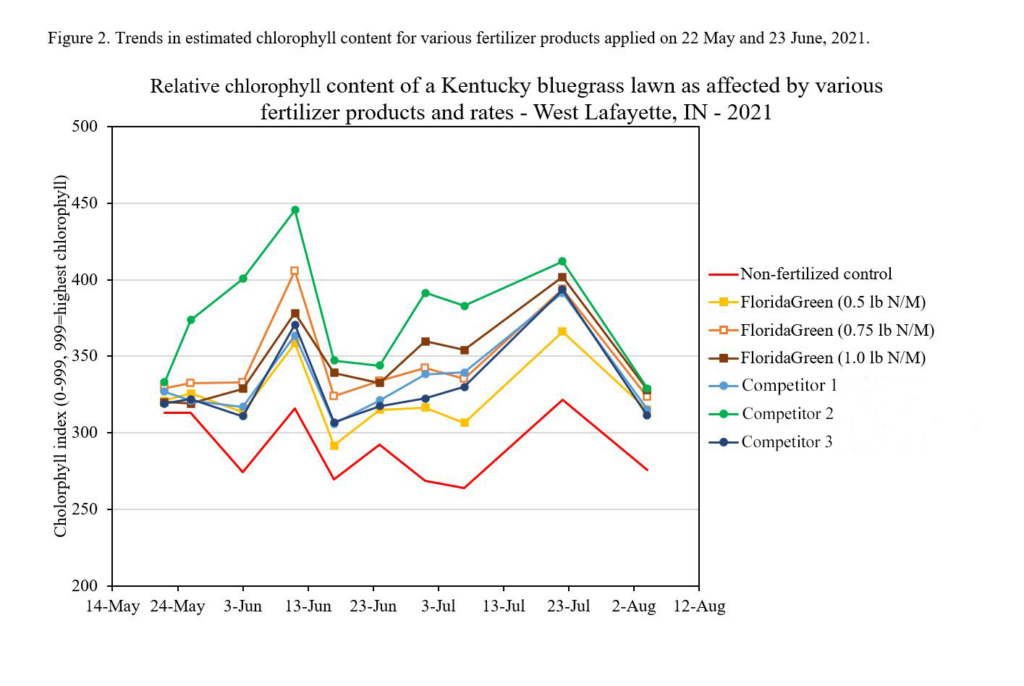
Relative Chlorophyll Content
For relative chlorophyll content, values ranged between 274-446, with all treatments being superior to the non-treated control.
From 11 June to 22 July, all fertilizer treatments had increased relative chlorophyll content compared to the non-fertilized control.
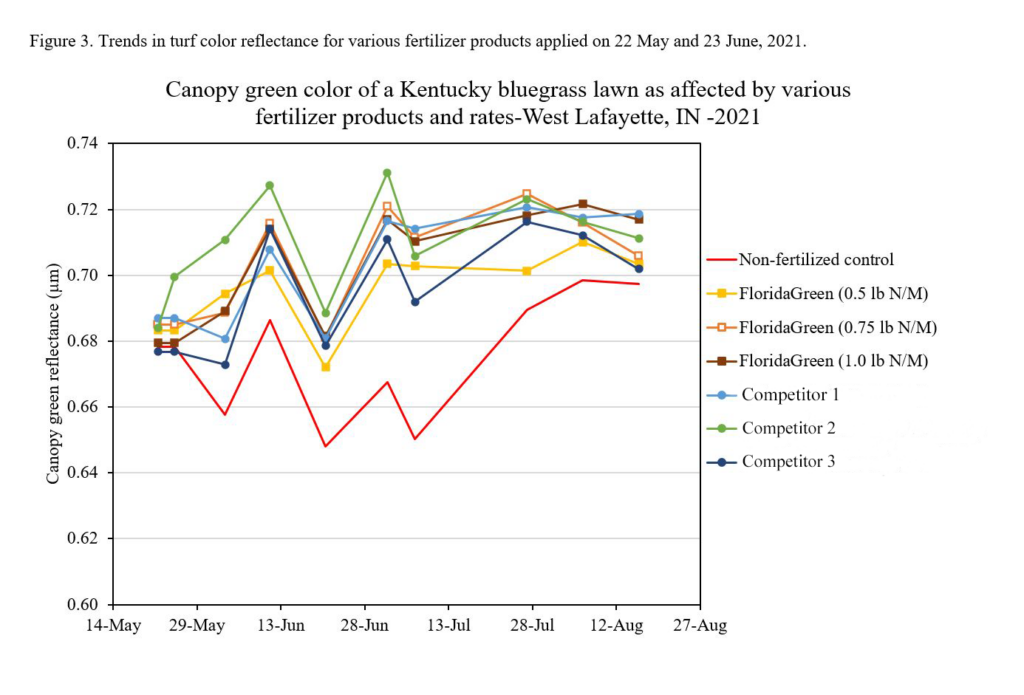
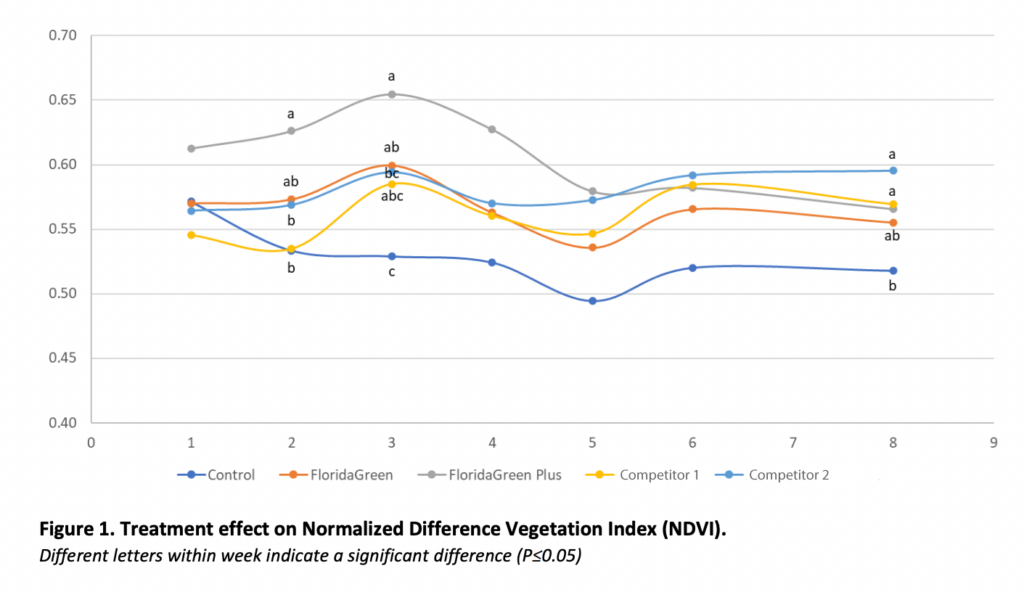
Turf Color
For turf color, the mean values ranged from 0.655-0.706, with all treatments being superior to the non-treated control.
Increased color was observed in all fertilization treatments, while the lowest turf color values were observed in plots without nitrogen applications.